Profiling PyPy using the Firefox profiler user interface
Introduction
If you ever wanted to profile your Python code on PyPy, you probably came across VMProf — a statistical profiler for PyPy.
VMProf's console output can already give some insights into where your code spends time, but it is far from showing all the information captured while profiling.
There have been some tools around to visualize VMProf's output. Unfortunately the vmprof.com user interface is no longer available and vmprof-server is not as easy to use, you may want to take a look at a local viewer or converter. Those so far could give you some general visualizations of your profile, but do not show any PyPy related context like PyPy's log output (PyPyLog, which is output when using the PYPYLOG environment variable to log JIT actions).
To bring all of those features together in one tool, you may take a look at the vmprof-firefox-converter.
Created in the context of my bachelor's thesis, the vmprof-firefox-converter is a tool for analyzing VMProf profiles with the Firefox profiler user interface. Instead of building a new user interface from scratch, this allows us to re-use the user interface work Mozilla put into the Firefox profiler. The Firefox profiler offers a timeline where you can zoom into profiles and work with different visualizations like a flame graph or a stack chart. To understand why there is time spent inside a function, you can revisit the source code and even dive into the intermediate representation of functions executed by PyPy's just-in-time compiler. Additionally, there is a visualization for PyPy's log output, to keep track whether PyPy spent time inside the interpreter, JIT or GC throughout the profiling time.
Profiling word count
In this blog post, I want to show an example of how to use the vmprof-firefox-converter for a simple Python program. Based on Ben Hoyt's blog Performance comparison: counting words in Python, Go, C++, C, AWK, Forth, and Rust we will profile two python versions of a word counter running on PyPy. One being a bit more optimized. For this, VMProf will be used, but instead of just going with the console output, we will use the Firefox profiler user interface.
At first, we are going to look at a simple way of counting words with Collections.Counter.
This will read one line from the standard input at a time and count the words with counter.update()
counts = collections.Counter()
for line in sys.stdin:
    words = line.lower().split()
    counts.update(words)

for word, count in counts.most_common():
    print(word, count)
To start profiling, simply execute:
pypy -m vmprofconvert -run simple.py <kjvbible_x10.txt
This will run the above code with vmprof, automatically capture and convert the results and finally open the Firefox profiler.
The input file is the king James version of the bible concatenated ten times.
To get started, we take a look at the call stack.
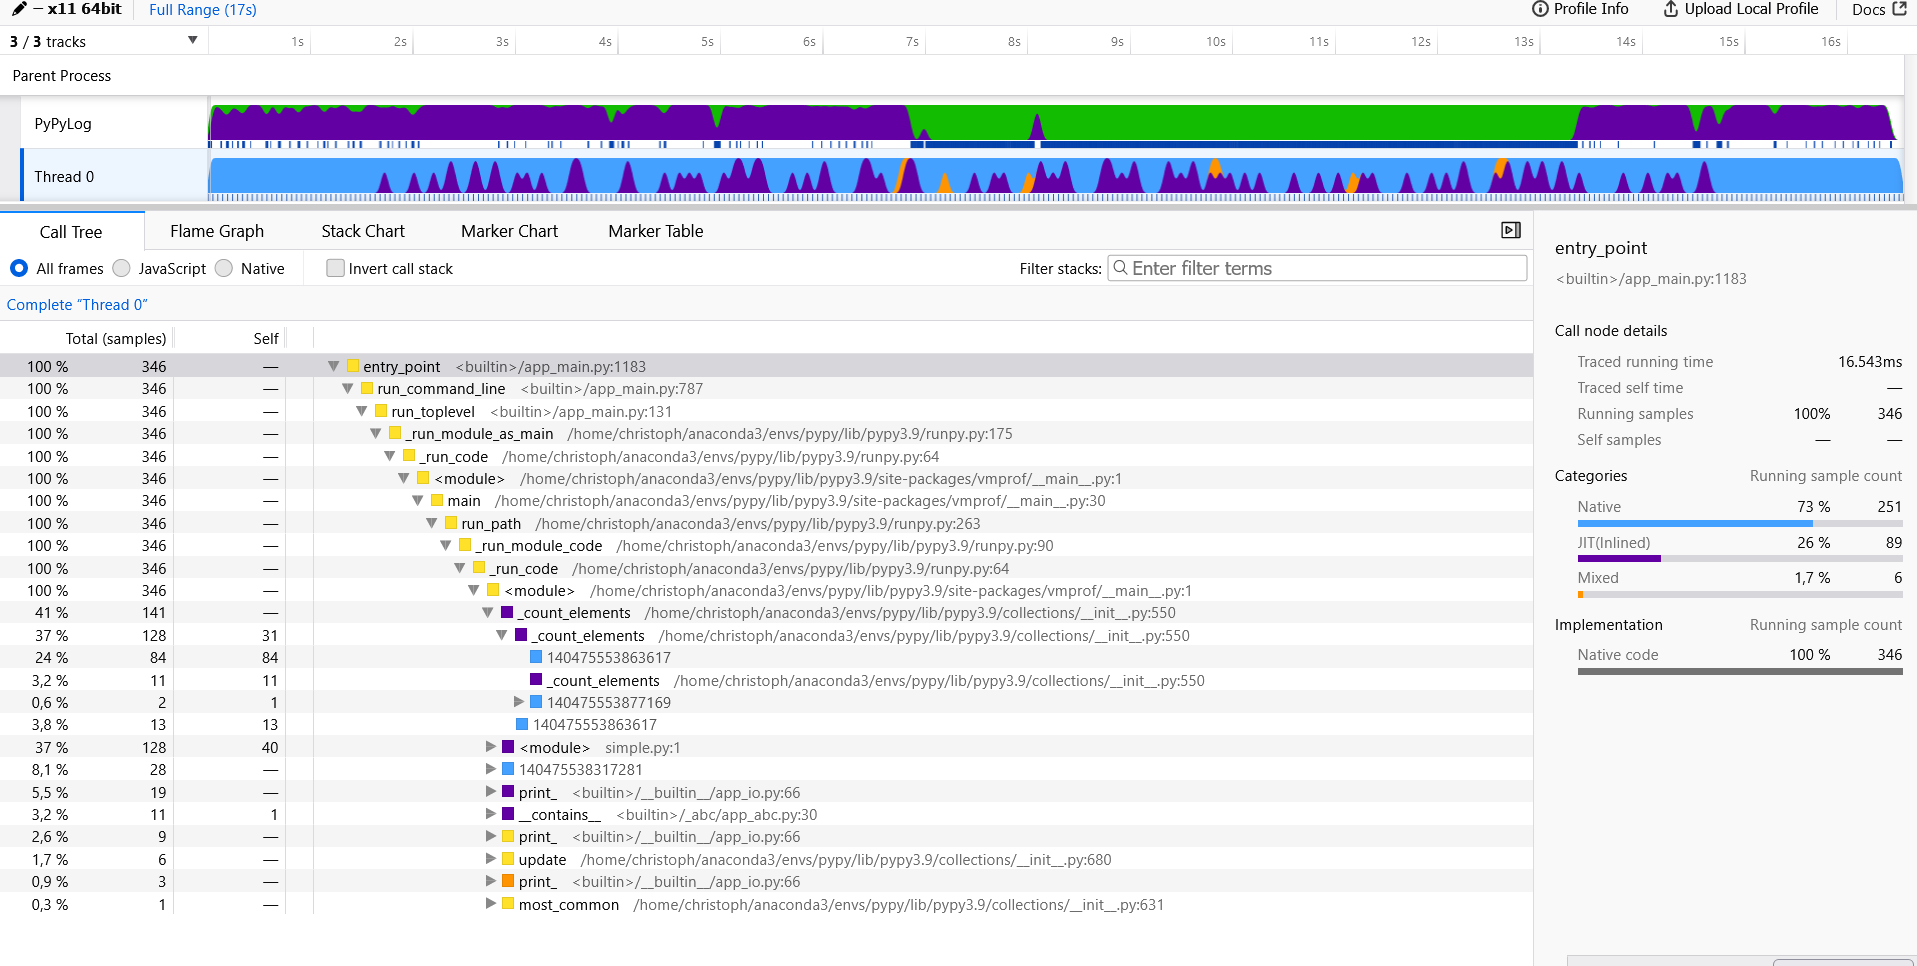 Here we see that most of the time is spent in native code (marked as blue) e.g., the
 counter.update() or split() C implementation.
Now let's proceed with the more optimized version.
This time we read 64 Kb of data from the standard input and count the words with counter.update().
counts = collections.Counter()
remaining = ''
while True:
    chunk = remaining + sys.stdin.read(64*1024)
    if not chunk:
        break
    last_lf = chunk.rfind('\n')  # process to last LF character
    if last_lf == -1:
        remaining = ''
    else:
        remaining = chunk[last_lf+1:]
        chunk = chunk[:last_lf]
    counts.update(chunk.lower().split())

for word, count in counts.most_common():
    print(word, count)
As we did before, we are going to take a peek at the call stack.

Now there is more time spent in native code, caused by larger chunks of text passed to counter.update().
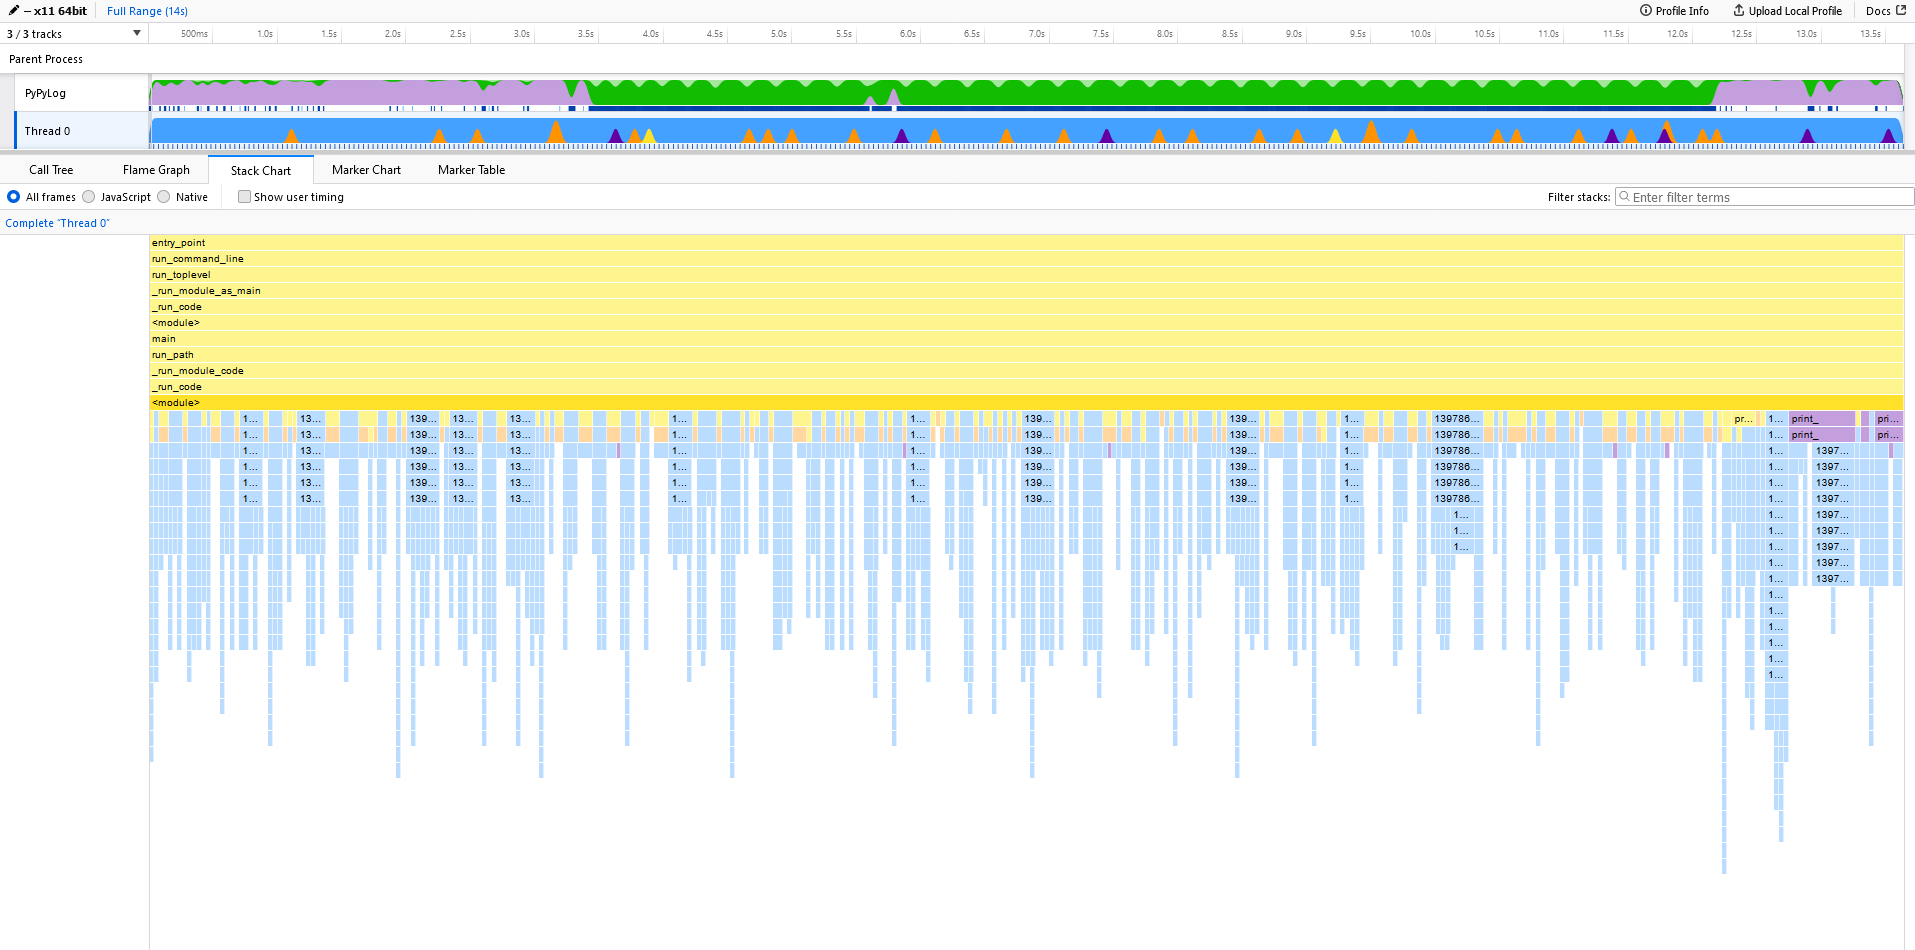
This becomes even more clear by comparing the stack charts.

Here, in the unoptimized case, we only read in one line at each loop iteration. This results in small "spikes" in the stack chart.
But let's take an even closer look.

Zoomed in, we see the call stack alternating between _count_elements() and (unfortunately unsymbolized) native calls coming from reading and splitting the input text (e.g., decode()).
Let us now take a look at the optimized case.
And if we look closer at the same interval as before, we see some spikes, but slightly different.

Even though we do not want to compare the (amount of) milliseconds directly, we clearly see that the spikes are wider, i.e. the time spent in those function calls is longer.
You may already know where this comes from.
We read a 64 Kb chunk of data from std in and pass that to counter.update(), so both these tasks do more work and take longer.
Bigger chunks mean there is less alternating between reading and counting, so there is more time spent doing work than "doing" loop iterations.
Getting started
You can get the converter from GitHub.
Both VMProf and the vmprof-firefox-converter were created for profiling PyPy, but you can also use them with CPython.
This project is still somewhat experimental, so if you want to try it out, please let us know whether it worked for you.
Comments